

European procurement teams are no longer evaluating solenoid coil suppliers on price, lead time, and performance alone. As CSRD, CBAM, and Scope 3 reporting requirements reshape industrial purchasing, buyers increasingly expect product-level carbon data that can withstand audit and supplier comparison. For solenoid coils used in automotive systems, engineering machinery, and fluid control valves, this means calculating emissions from copper windings, plastics, energy use, transport, and production processes with clear boundaries. This article explains why carbon footprint calculation matters, how cradle-to-gate assessments are applied, which standards suppliers should follow, and what data European buyers now expect before approving or renewing supply contracts.
Why Carbon Footprint Calculation Matters for Solenoid Coils
As European industries accelerate their transition toward net-zero emissions, procurement strategies for electromechanical components are undergoing a fundamental shift. Solenoid coils, which serve as critical actuators in automotive systems, engineering machinery, and fluid control valves, are now subject to rigorous environmental scrutiny.
The implementation of frameworks like the Corporate Sustainability Reporting Directive (CSRD) and the Carbon Border Adjustment Mechanism (CBAM) means that European buyers can no longer focus solely on cost and technical specifications. Calculating the carbon footprint of these components has evolved from a voluntary sustainability initiative into a mandatory compliance requirement for market access.
European Sustainability Expectations
European sustainability expectations have moved beyond generic corporate pledges to demand granular, product-level environmental data. Original Equipment Manufacturers (OEMs) and Tier 1 suppliers are increasingly mandating that their supply chains disclose Scope 3 emissions. Many European industrial buyers are targeting a 30% reduction in supply chain emissions by 2030, a goal that trickles down directly to component manufacturers.
To meet these expectations, suppliers must provide a Product Carbon Footprint (PCF) for every batch of solenoid coils exported. Failure to provide accurate carbon accounting can result in a supplier being disqualified from future tenders, as European buyers must aggregate these figures to report their own corporate emissions to regulators and stakeholders.
Lifecycle Boundaries Buyers Should Define
Before calculating emissions, European buyers and international suppliers must agree on the lifecycle boundaries of the assessment. The most common framework for industrial components is the “cradle-to-gate” approach. This boundary includes raw material extraction, transportation to the manufacturing facility, and the energy consumed during winding, overmolding, and final testing.
Defining these boundaries prevents discrepancies in reporting. For example, a standard 150-gram solenoid coil might generate between 0.8 and 1.5 kg of CO2 equivalent (CO2e) under a cradle-to-gate boundary, heavily dependent on the local energy grid. If suppliers mistakenly include “cradle-to-grave” metrics—which factor in the energy the coil consumes over its operational life—the footprint could appear artificially inflated, leading to unfair vendor comparisons.
How Suppliers Should Calculate Solenoid Coil Carbon Footprints
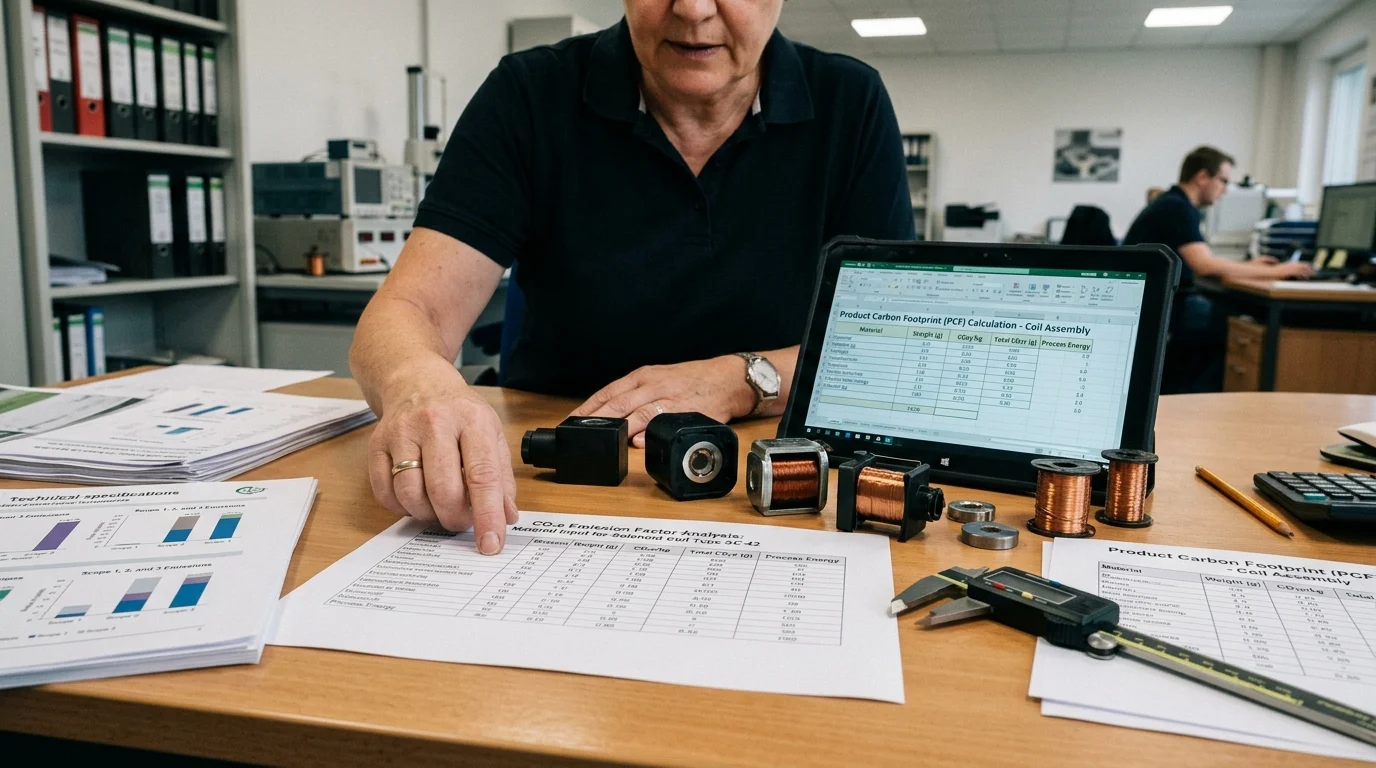
For suppliers of solenoid coils, accurately calculating carbon footprints requires transitioning from rough estimates to precise, standard-compliant methodologies. Adhering to international standards such as ISO 14067 or the Greenhouse Gas (GHG) Protocol ensures that the data provided to European buyers is both credible and comparable.
The calculation process demands a meticulous breakdown of the Bill of Materials (BOM) and the energy inputs required for manufacturing. Leading enterprises specializing in automotive and engineering machinery valves and coils understand that refined quality management naturally supports better resource tracking. By analyzing material waste and machine energy consumption, suppliers can isolate the specific processes that drive their carbon footprint.
Key Emissions Drivers in Copper Windings
The materials used in solenoid coils are the primary contributors to their overall carbon footprint. Copper, essential for the electromagnetic windings, is particularly carbon-intensive due to the energy required for mining, smelting, and drawing the wire. In a typical solenoid coil, high-purity copper wire accounts for 60% to 70% of the total embedded emissions.
Beyond the copper, the plastic encapsulation—often utilizing materials like Polyamide 66 (PA66) or Polyethylene Terephthalate (PET)—adds another 15% to 20% to the product’s footprint. The remaining emissions stem from the steel yokes, terminals, and the electricity used during the winding and injection molding processes.
| Component / Process | Material Example | Typical Mass Share (%) | Est. Carbon Footprint Share (%) |
|---|---|---|---|
| Windings | High-purity Copper | 45% | 65% |
| Encapsulation | PA66 / PET | 25% | 18% |
| Magnetic Frame / Yoke | Low-carbon Steel | 28% | 12% |
| Manufacturing Energy | Electricity (Grid) | N/A | 5% |
Comparison Criteria for European Buyers
European buyers utilize specific comparison criteria to evaluate supplier carbon reports. A critical distinction is made between primary data (actual energy bills and direct material tracking) and secondary data (industry averages pulled from lifecycle assessment databases). Suppliers who invest in primary data collection invariably score higher in procurement evaluations.
Furthermore, the energy mix used during production is heavily scrutinized. A supplier utilizing 100% renewable energy for their winding machines and molding equipment can reduce their manufacturing emissions by up to 40%. Buyers actively compare these localized energy factors, meaning a supplier in a region with a coal-heavy grid must optimize material efficiency even further to remain competitive against manufacturers operating on greener electrical grids.
How European Buyers Can Use Carbon Footprint Data
Possessing accurate carbon footprint data is only the first step; the true value emerges when European buyers integrate these metrics into their strategic procurement and engineering decisions. By treating carbon data as a key performance indicator alongside cost and lead time, buyers can actively decarbonize their supply chains.
Many European procurement teams are now embedding carbon limits directly into their Request for Quotation (RFQ) documents. This shift requires a structured approach to verifying data and ensuring that the pursuit of lower emissions does not inadvertently compromise the reliability of critical electromechanical components.
Steps for Credible Product Carbon Reporting
To utilize carbon data effectively, European buyers must establish steps for credible product carbon reporting. This begins with demanding third-party verification of supplier Life Cycle Assessments (LCAs). Relying solely on self-reported spreadsheets leaves buyers vulnerable to “greenwashing” and regulatory penalties under stringent EU directives.
Once verified, buyers can set hard thresholds for procurement. For instance, a buyer might mandate a maximum threshold of 8.5 kg CO2e per kilogram of finished coil weight. Suppliers exceeding this limit are either disqualified or required to submit a funded decarbonization roadmap. By aggregating this verified data, European OEMs can confidently market their finished machinery or automotive systems as lower-carbon alternatives, securing a competitive edge in environmentally conscious markets.
Balancing Carbon Performance with Quality Requirements
While lowering the carbon footprint is essential, buyers must carefully balance environmental performance with stringent quality requirements to ensure the ongoing reliability
Key Takeaways
- Define a cradle-to-gate lifecycle boundary before comparing solenoid coil suppliers to avoid inconsistent or inflated carbon footprint data.
- Use ISO 14067 or the Greenhouse Gas Protocol when calculating Product Carbon Footprints so European buyers can trust and compare submitted figures.
- Track copper usage, resin consumption, scrap rates, and machine energy data by batch because these inputs drive most solenoid coil emissions.
- Expect European OEMs and Tier 1 buyers to request Scope 3 emissions data as they work toward supply chain reductions of about 30% by 2030.
- Prepare accurate PCF documentation for exported solenoid coils because missing or unreliable carbon data can lead to tender disqualification.
Frequently Asked Questions
Why are European buyers asking for carbon footprint data for solenoid coils?
European buyers need product-level emissions data to meet CSRD, CBAM, and Scope 3 reporting requirements. Without credible Product Carbon Footprint data, suppliers may be excluded from tenders.
What is a Product Carbon Footprint for a solenoid coil?
A Product Carbon Footprint measures the CO2 equivalent emissions linked to producing a solenoid coil, typically including raw materials, transport, winding, overmolding, assembly, and testing under a defined boundary.
Which lifecycle boundary is most common for solenoid coil carbon calculations?
The most common boundary is cradle-to-gate, covering raw material extraction, inbound transport, and manufacturing until the product leaves the factory.
What standards should suppliers use for carbon footprint calculation?
Suppliers should align calculations with recognized frameworks such as ISO 14067 and the Greenhouse Gas Protocol to ensure data is credible, comparable, and accepted by European procurement teams.
What are the main emissions drivers in solenoid coil production?
Copper windings, resin or plastic overmolding, electricity used in winding and testing, material waste, and the local energy grid mix are major contributors to the total footprint.
Post time: Jun-27-2026